In the realm of exploration strategy, I'm a big fan of greenfields over brownfields, at least for terranes with higher than moderate exploration maturity. Unless you are exploring a deep system, the probability that the first discoveries in a district are the largest, or at least connected to the largest, is high. The surrounding deposits within the cluster are likely small. This creates a potentially unfavourable environment for exploration: lots of smoke to chase and an endowment curve depleted of the low-probability large deposits, which are the major value source in exploration. This is exploration maturity in action! However, it's healthy to challenge our base assumptions from time to time, so I thought I would put this to the test. To explore the idea, I conducted a simple analysis by taking a snapshot in time (in my case, 1992) and examining the implications of pursuing either strategy.
Analysis Setup:
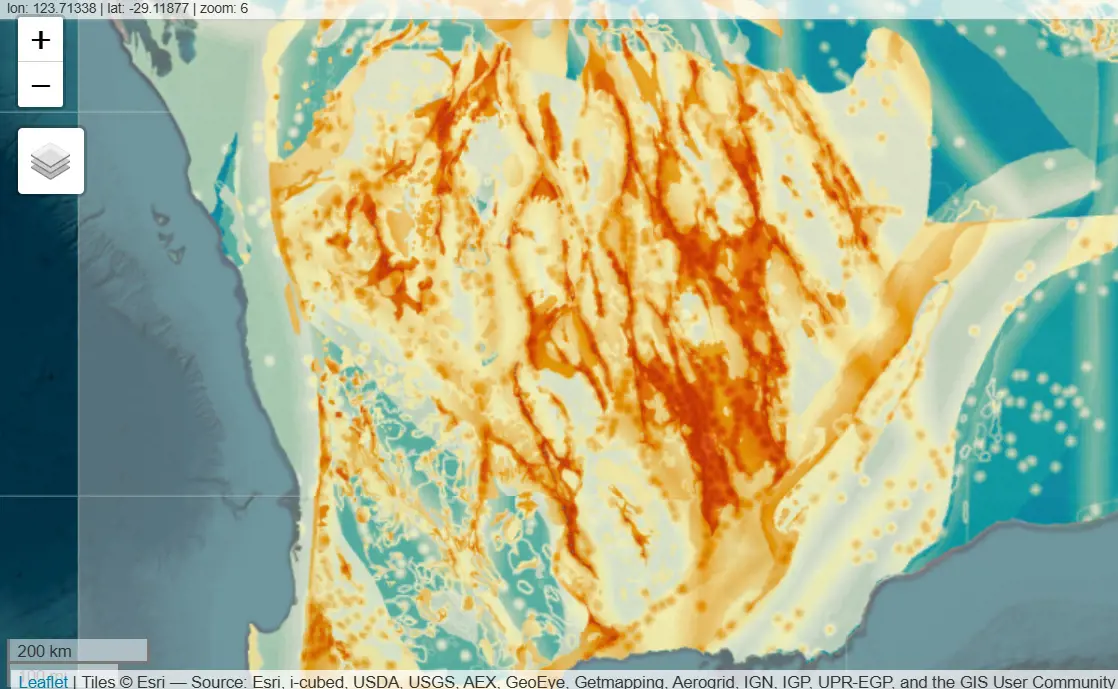
To conduct the analysis, I return to my favourite exploration sandbox: West Australian gold exploration. I have limited the analysis to the Yilgarn Craton area. I envisaged myself as an explorer acquiring projects at the end of 1992, with free rein to acquire up to 5,000 km² of licence area. To keep exploration area selection realistic, I assumed that I was in the position of this mineral systems prospectivity map to help guide my licence selection, pictured below.
I have also assumed that the licences in existence today are the same as they were in 1992. While this is not entirely accurate, it is unlikely to bias the analysis and is much easier than modelling the changing licence boundaries over time!
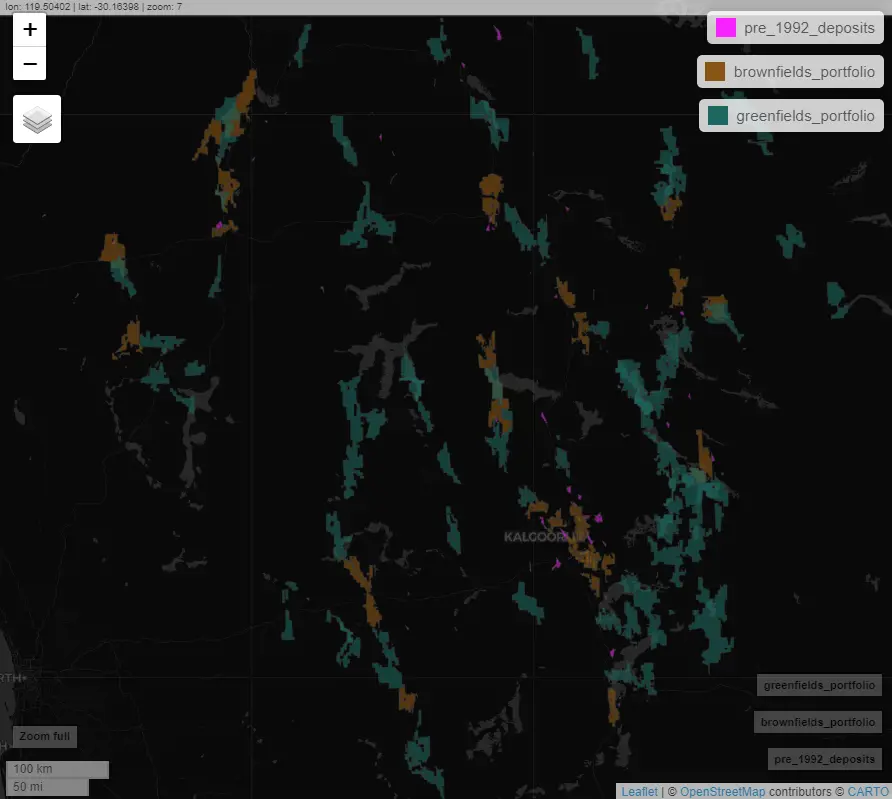
My licence selection proceeds in much the same way as in my previous article, where I first identify 100 km² target areas of broad prospectivity and select licences that intersect with these target areas. For the brownfields strategy, I have limited the target areas to within 15 km of any gold deposit discovered prior to 1992 that had a resource of at least 200,000 oz. The resource threshold filters out the minor mineral occurrences. The greenfields strategy utilised the inverse of this, generating only target areas more than 15 km from the pre-1992 deposits. Note that there is some overlap of each strategy in certain areas near the 15 km deposit boundary. The licence portfolios generated for each are shown in the map below:
After generating the licence portfolios for each strategy, it was assumed these were explored fully in the same manner as they were in real life since 1992. Therefore, the post-1992 discoveries are attributed to each (again, I have implemented a 200,000 oz threshold), and the quantum of real-life exploration in terms of RC/DD holes drilled post-1992 is attributed to each. The resource expansions to existing deposits that occurred post-1992, and their respective drilling, are not included in this analysis.
Results:
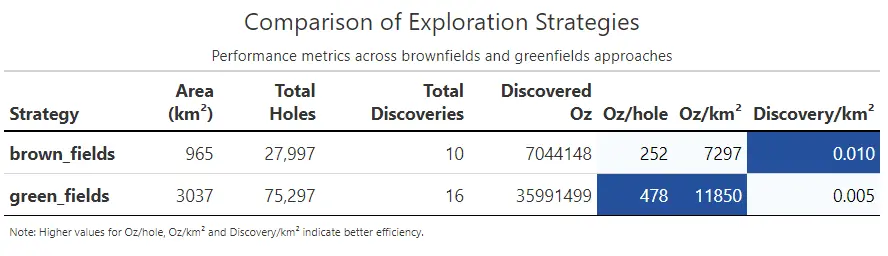
As might be expected, the greenfields strategy led to a much larger licence portfolio. Away from major discoveries, it is often much easier to assemble large project areas, and this is needed to implement greenfields exploration. Note that both strategies exhausted their options in terms of identifying licences that matched their criteria.
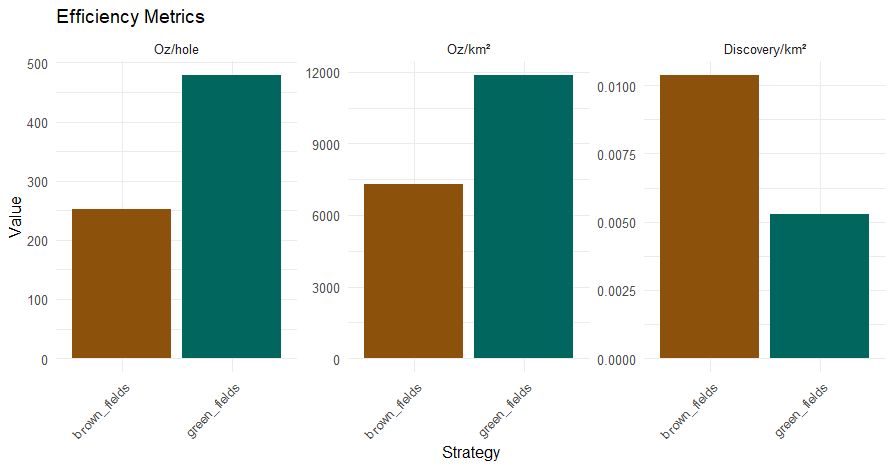
The RC/DD drilling density is higher in the brownfields environment (29.0 vs 24.8 holes/km²), although perhaps not to the extent I might have predicted. However, in line with my predictions, the brownfields strategy has resulted in a higher number of discoveries per km², but these discoveries are generally smaller than their greenfields counterparts. This results in a much higher total ounces discovered employing the greenfields strategy. Consequently, the greenfields strategy yields higher ounce per hole and ounce per km² metrics, indicating that exploration could be more efficient in these areas in terms of $/oz discovery cost.
There are aspects missing from this analysis. It would be fair to assume that a greenfields explorer would have to spend significantly more than a brownfields explorer pre-drilling. In some areas, the cost of maintaining such a large licence portfolio may also be a key concern. Acquiring such a large greenfields licence portfolio would be a challenge, though similar challenges occur in the brownfields environment where licences are often more fragmented and the transaction prices higher. However, in terms of drilling 'bang for buck', I think greenfields likely still wins out and is also likely to result in discovering more ounces if correctly executed.
Conclusion
Though I favour greenfields, I'm not sure there is any 'right' answer to which strategy is best for all explorers. There are some excellent explorers who have built a niche in the brownfields environment. For juniors that require a constant stream of good news to support fundraising activities, the higher Discovery/km² metric of brownfields is alluring as it translates to a more reliable source of positive results. However, in terms of pure exploration efficiency, I remain convinced that greenfields has the most to offer.
I hope you found this brief analysis interesting. Here at SRK Exploration, I head our Data Analytics team, which can conduct various analyses on all aspects of the exploration and mining sector in greater detail than presented here. We also offer the full suite of regional prospectivity modelling (mineral systems, machine learning, Bayesian), as well as analytical solutions to a range of other exploration problems such as mapping potential ESG risks, optimal sampling regimes, and remote sensing applications. Please get in touch to learn more!