Sustainable tailings management often depends on directing finite capital to where it most reduces overall portfolio risk: not only life-safety, but also environmental, social, and reputational impacts, in line with the spirit of the Global Industry Standard on Tailings Management. SRK recently completed a semi-quantitative tailings storage facility (TSF) risk assessment for a client with operations across North and South America. Tailings dam risks were initially evaluated using the client’s corporate, TSF-specific risk matrices and F-N curves, which plot the annual probability of failure (F) against the potential loss of life (N) to guide risk tolerability.
While F-N curves are a valuable benchmarking tool for fatality risks, they do not on their own support prioritization and capital allocation across the TSF portfolio. Their focus is narrow: capturing only fatality-risk through Potential Loss of Life (PLL) estimates and excluding environmental, legal, and reputational impacts. Their exposure assumptions also distort comparison: PLL accounts for population exposure, so calculated fatality risk falls when fewer people are present, whereas environmental impacts are fully exposed (effectively 100%) and can therefore be underrepresented when non-safety consequences dominate. F-N curves also overemphasize rare extremes: a catastrophic dam breach can appear more critical than a dam experiencing frequent, localized failures that release tailings to the environment. Yet the latter may represent a higher overall risk in expected annual terms, with greater implications for long-term sustainability.
To overcome these limitations, SRK broadened the framework along three lines. The assessment extended beyond life-safety to the consequence types listed above. Annual probabilities of failure (without exposure adjustment) were used for all consequence types, while PLL remained the basis for life-safety. A financial proxy then expressed every consequence in monetary terms, allowing consistent comparison across sites and categories; integrating the F-Cost curve yields the total risk as expected annual financial loss.
In practice, this dual framework provides a defensible life-safety benchmark together with a financially grounded measure for portfolio prioritization, weighing catastrophic-but-rare failures against recurring mid-level risks that quietly accumulate higher expected annual losses, and aligning risk management with broader sustainability objectives.
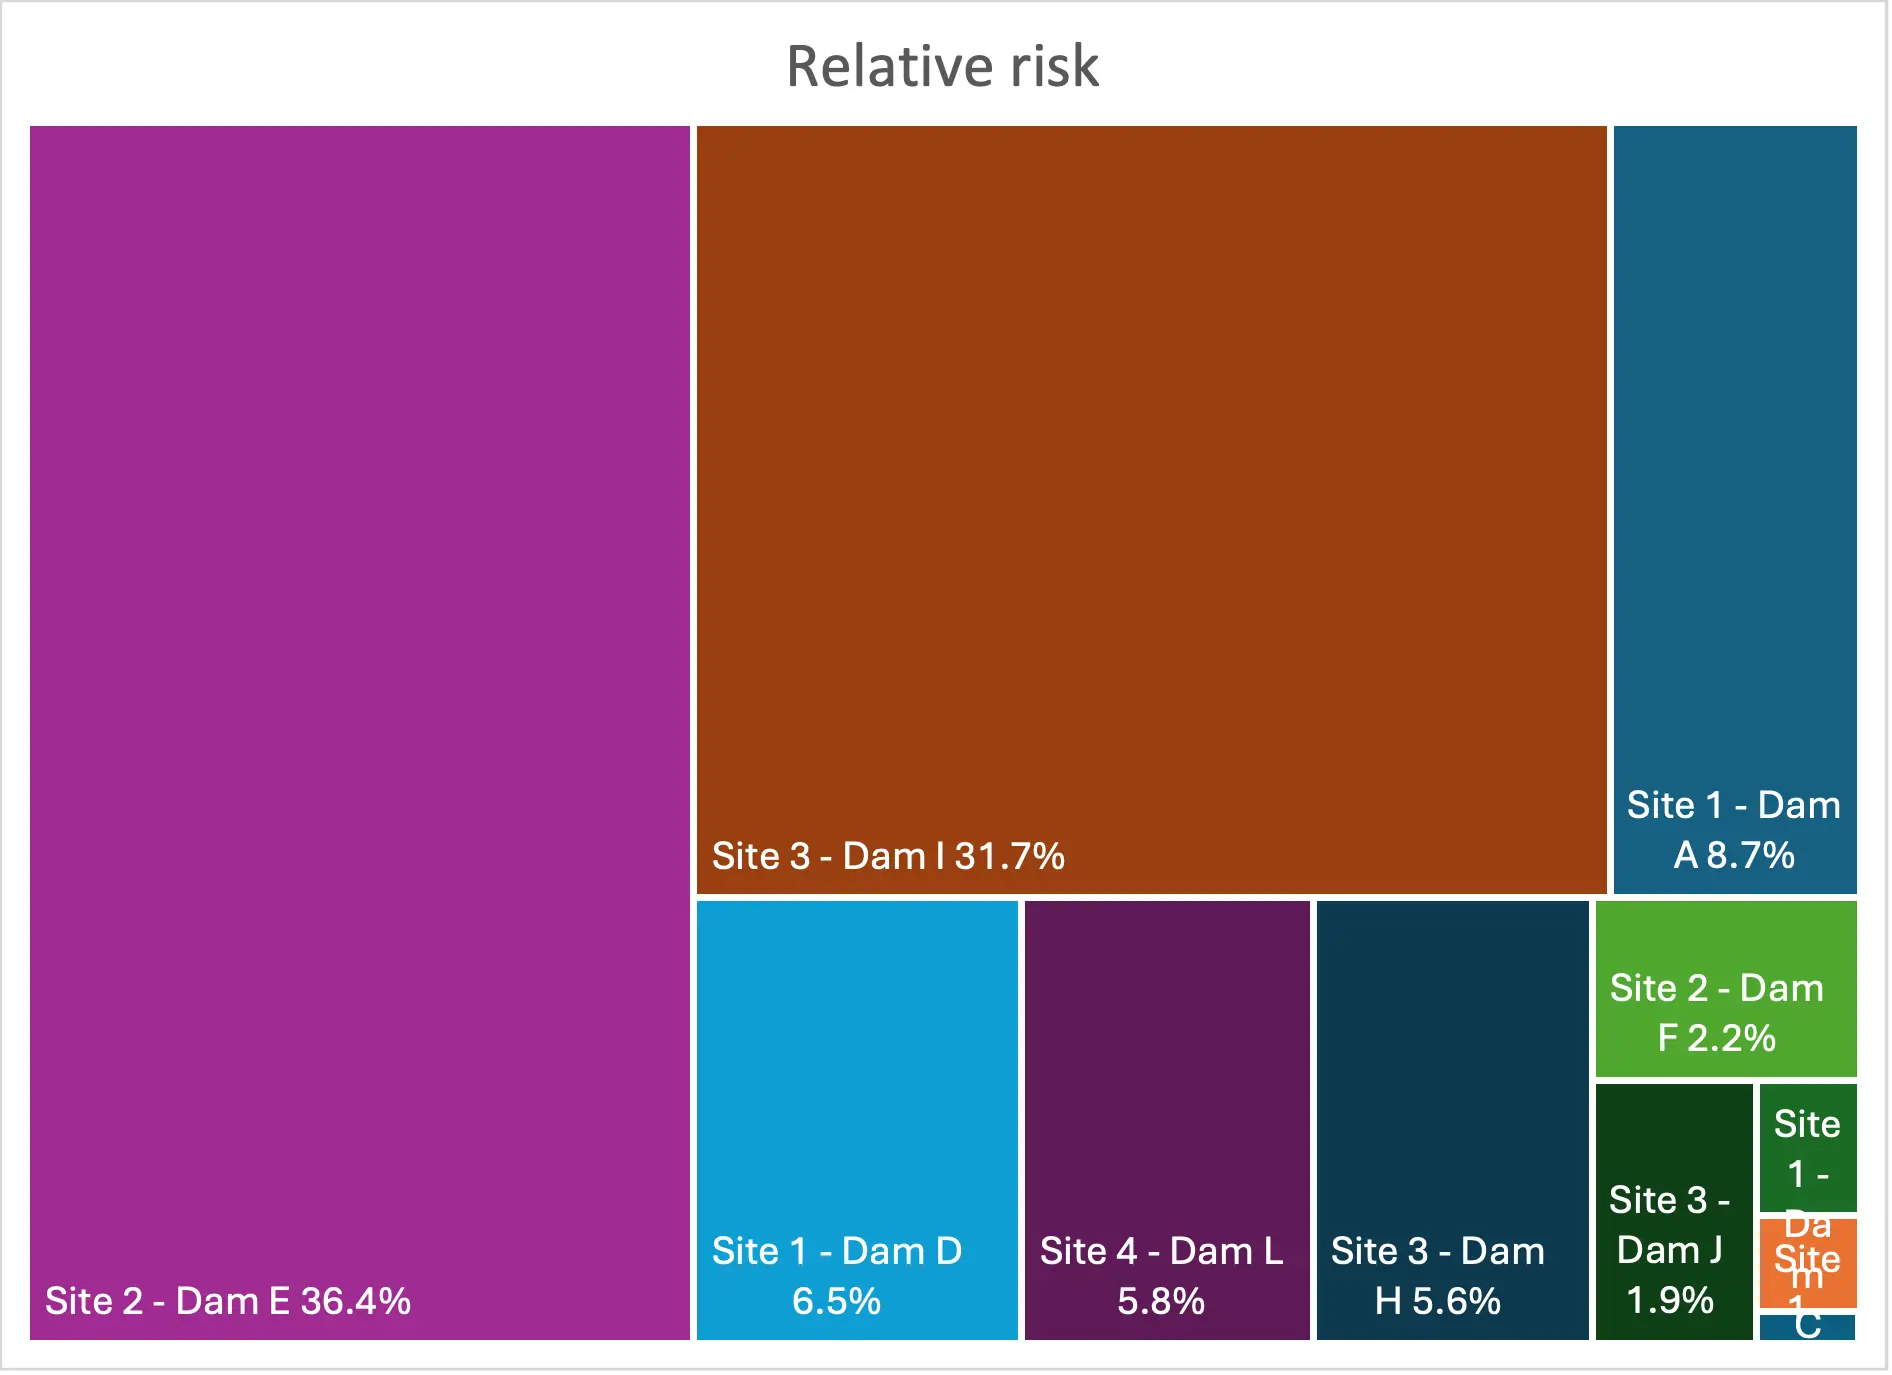
Figures 1 and 2 illustrate the outcome for the assessed portfolio of 12 TSFs across four sites. The F-Cost curves plot the annual exceedance probability against total expected loss (M$) on a common monetary scale; the resulting treemap then makes immediately visible that two TSFs together account for roughly two-thirds of portfolio risk, sharpening where capital allocation has the greatest impact.