ORE2_Tailings™’s Potential Failure Causality Analysis is one of the features of Riskope’s tailings dam−specific application.
ORE2_Tailings looks at the causes of dam failure rather than the reasons why dams fail (the failure modes). That is because the root cause of dam failure is typically the result of a combination of deviances. Recent forensic studies on major catastrophic failures have demonstrated this.
Normalization of Deviance
Catastrophic failures, like most major accidents, are indeed always generated by an unfortunate mix of multiple causes. Normalization of deviance (from original intent, design, scope, etc.) on one or more aspects of the dam life end up generating the conditions for failure.
ORE2_Tailings looks at detected or suspected deficiencies in the following areas:
- sampling and testing including in situ and lab tests
- design, including:
- initial understanding of geological and geotechnical conditions
- robustness of the cross-section
- project soundness, including documentation and:
- stability
- seepage
- liquefaction
- settlement
- construction, including:
- quality of supervision
- possible errors and omissions
- divergence from plans
- operations and maintenance, including:
- monitoring
- inspections
- reviews
- repairs
Accounting for Uncertainties
For each area, the analysts express a judgment encoded in a number. Two sets of opinions (A,B) are analyzed and their average evaluation is used. If the A,B opinions are too different, it is better for the analysts to reassess their stance and reach a consensus before proceeding. This may require additional studies.
However, A,B will always exist and are necessary. That is because of the uncertainties on many aspects of the structure life from inception to the date of evaluation. It is not recommended for a single analyst to perform the evaluations as these obviously include an individual’s perception and judgment.
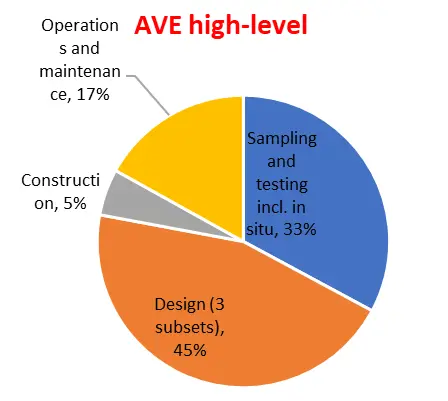
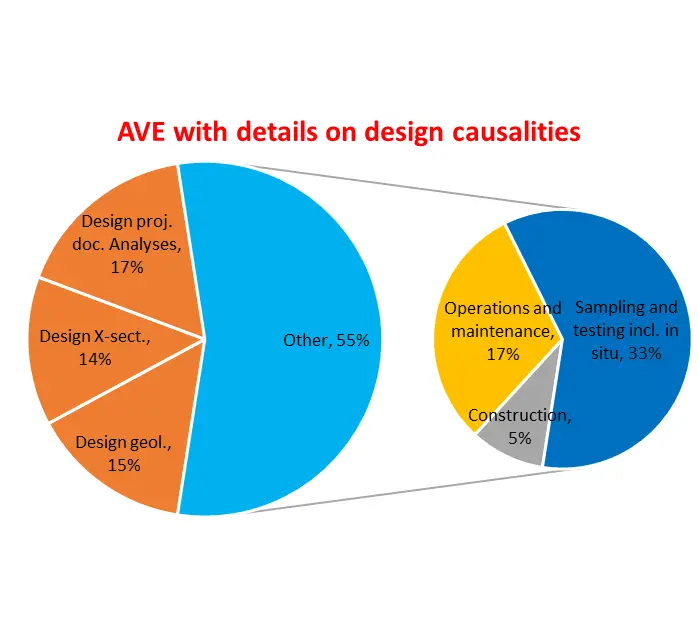
The graphs below describe the causalities (%) globally (left) and then in more detail (right) for a specific real-life dam. As ORE2_Tailings mimics the results of major forensic investigations performed in the aftermath of recent catastrophic failures, none of the areas will ever show up with nil causality.
In the considered case we see that construction, operations and maintenance comprise only 22% of the causality, whereas design, sampling and testing represent 78% of the causality. This is due, in the considered case and among others, to weakness of some assumptions (peak resistance in undrained conditions, for example), poor consideration for static liquefaction and defects of the water management systems (no diversion ditch, near-miss overtopping, etc.).
ORE2_Tailings Potential Failure Causality Analysis Closing Remarks
ORE2_Tailings’s Potential Failure Causality Analysis is one of the features of Riskope’s tailings dam−specific application.
When tackling large portfolios, it is interesting to study how the causality analysis varies by region, operation, and construction time.
Once a risk assessment is performed, portfolio owners can then prepare guidelines to enhance the knowledge base and mitigate risks, after evaluating the probabilities of failure and the consequences for each structure.