We split this chapter into two sections.
Section 10.1 discusses what actions one can take to enhance the knowledge base. These are obvious “simple” procedural mitigations. They lead to a better understanding of the risks and/or how to mitigate them.
Section 10.2 shows how to deploy ORE2_Tailings™ during the mitigation design process in order to support decision-making. The goal is to define rational and sustainable risk mitigation programs. This process has to occur in parallel with the design by the engineer of record (EoR) of the dams. Indeed, it requires cost estimates of the various potential alternatives.
10.1 Actions to Increase the Knowledge Level and “Simple” Mitigations
Takeaway #9 is risk-informed recommendations for each site/dam represented at the beginning by a series of knowledge-based enhancement actions and/or simple procedural mitigations.
10.2 Example of ORE2_Tailings a Priori Deployment for Mitigative Decision-making Support
In this section, we show how ORE2_Tailings supports rational and sensible risk mitigation decision-making compliant with the Global Industry Standard on Tailings Management (GISTM).
In a recent communication, we showed a full example of this with related graphs and numerical results.
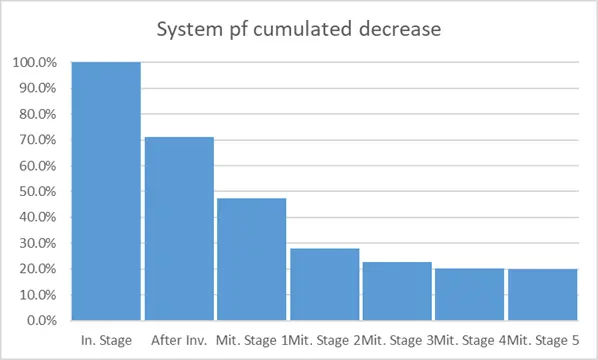
For example, the figure below shows the system probability of failure (pf)’s cumulated decrease as a function of the mitigation stage. Note the minimal estimated advantage in pursuing mitigation beyond a certain stage. We will discuss this decision support item later. Of course, jurisdictional compliance may force operators to diverge from the “optimum” path to mitigation.
As stated earlier, if one deploys ORE2_Tailings in parallel with the engineering studies, the methodology can support risk-informed decision-making, in this case the selection of mitigative alternatives and the return optimization.
Once risks are included together with the costs of each foreseen mitigative step, a true cost-benefit analysis can develop.
ALARP analyses
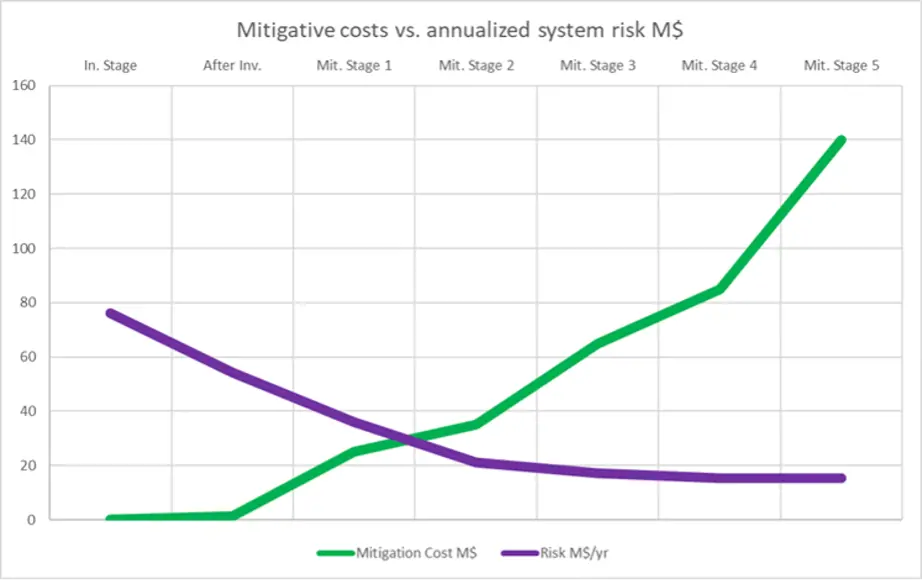
The crossing point of the two curves, i.e. risk vs. mitigation level and mitigation cost vs. mitigation level represents the “optimum”. The GISTM conformance documents (Figure 9) indicated this point as the As Low as Reasonably Practicable (ALARP) point.
In this specific example, the GISTM ALARP lies at a mitigation level between Stage 1 and 2. Thus one would select Stage 2 out of prudence and if there were no jurisdictional compliance issues and no public perception considerations.
As a side note, the crossing point corresponds to what some jurisdictions adopt as the “legal test for negligence.” This means that a company is not negligent if the mitigation expenses match at least the risk the considered facility generates.
Following the “legal test for negligence,” one determines the negligence of the injurer by the relationship between the probability of injurious event (p), the consequences of the resulting injury (C), and the burden, or cost, of adequate precautions or mitigations (M):
Negligence may occur if M < p*C.
In other words, a judge may deem a company negligent only if mitigative moneys M (capital expenditures (CAPEX) or per annum) are less than the annualized risks. The legal negligence test is not a critical test for an operation when confronted with risk perception and public reactions.
Perception Discussion
As a result, the discussion boils down to the following: is selecting Mitigation Stage 2 from a pure risk-engineering point of view enough (barring jurisdictional issues)?
The perception of some stakeholders is that the owner should still mitigate to Alternative 3 or higher.
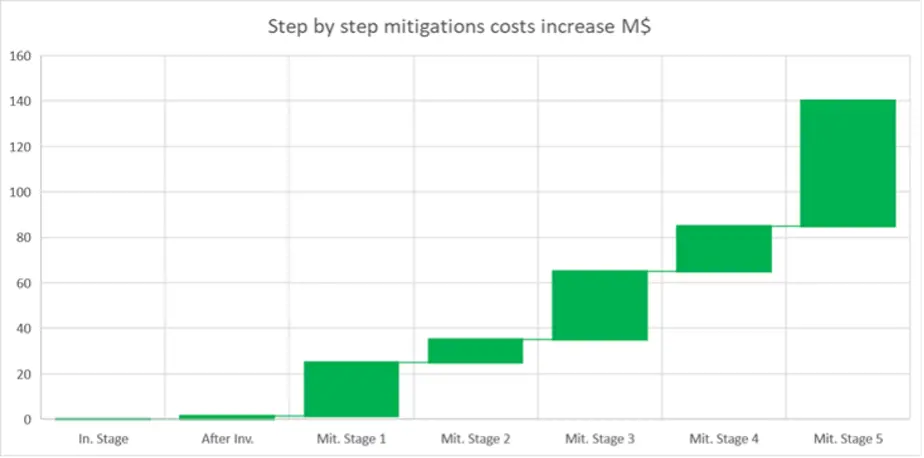
Going beyond Alternative 2 requires, using the costs we have assumed for this example, a sharp investment increase for what seems a modest risk mitigation benefit. In this example, the mitigation costs follow a steeper-than-linear increase across the mitigative stages (Figure below).
Indeed, we can see in the Figure above that Stage 1, 3 and 5 represent the biggest increases in the CAPEX development.
Now we focus on the mitigations in order to answer the question above.
Mitigation Efficiency
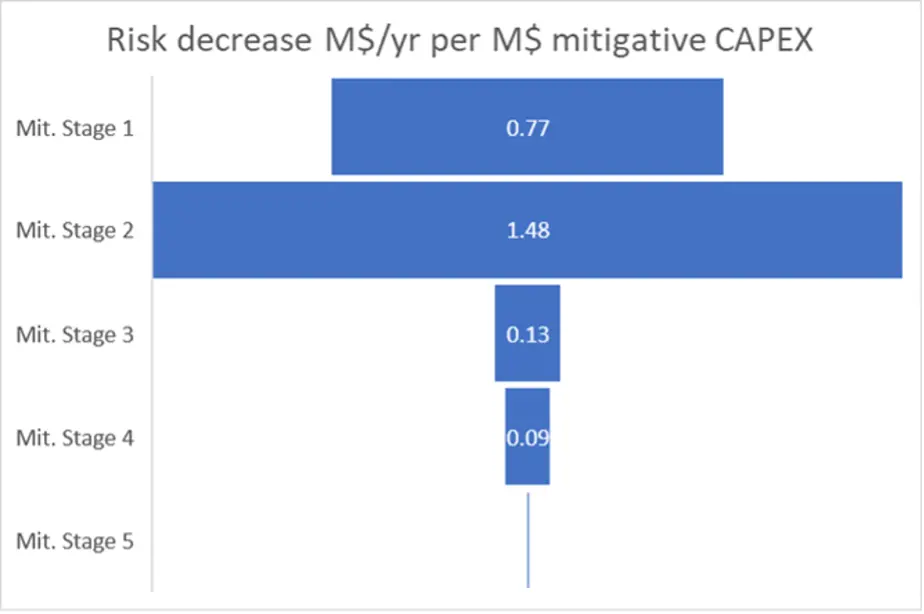
The next figure displays the ratio between the annualized risk decrease (M$/yr) and the mitigative CAPEX (M$) at each mitigation stage.
One can see the ratio as an efficiency evaluation of each mitigative stage. The figure shows that after Stage 2, the efficiency strongly decreases.
The owner and the EoR could easily argue at this point that if there are no specific regulatory compliance issues, any mitigation beyond Stage 2 would be too inefficient. This also corresponds to the reaching of the horizontal asymptote of the system pf. Indeed, as stated above, if Stage 2 complies with the GISTM ALARP criteria and the legal negligence test, it is also true that the system reaches horizontal asymptote of pf at Stage 3.
Closing Remarks
ORE2_Tailings deployment offers a solid foundation for discussion and negotiation. This will simultaneously address concerns from the public, regulators and insurers (if applicable). The statement will say that Stage 2 represents a valid possible choice for risk mitigation level.
This deployment example, using assumed initial knowledge and mitigation costs, shows that one can use ORE2_Tailings in full conformance with GISTM. The deployment can give useful indications to select and optimize the phasing of the various mitigation stages. It can foster healthy and rational technical and risk perception discussion, particularly on the level of desirable risk mitigation based on GISTM ALARP concept, the legal negligence test and the mitigative stages’ efficiency.