In this post, we will demonstrate how to interpret a previously presented ORE2_TailingsTM dam probability of failure (PoF) graph.
Dam Probabilities of Failure and ORE2_Tailings Benchmarking at Portfolio Level
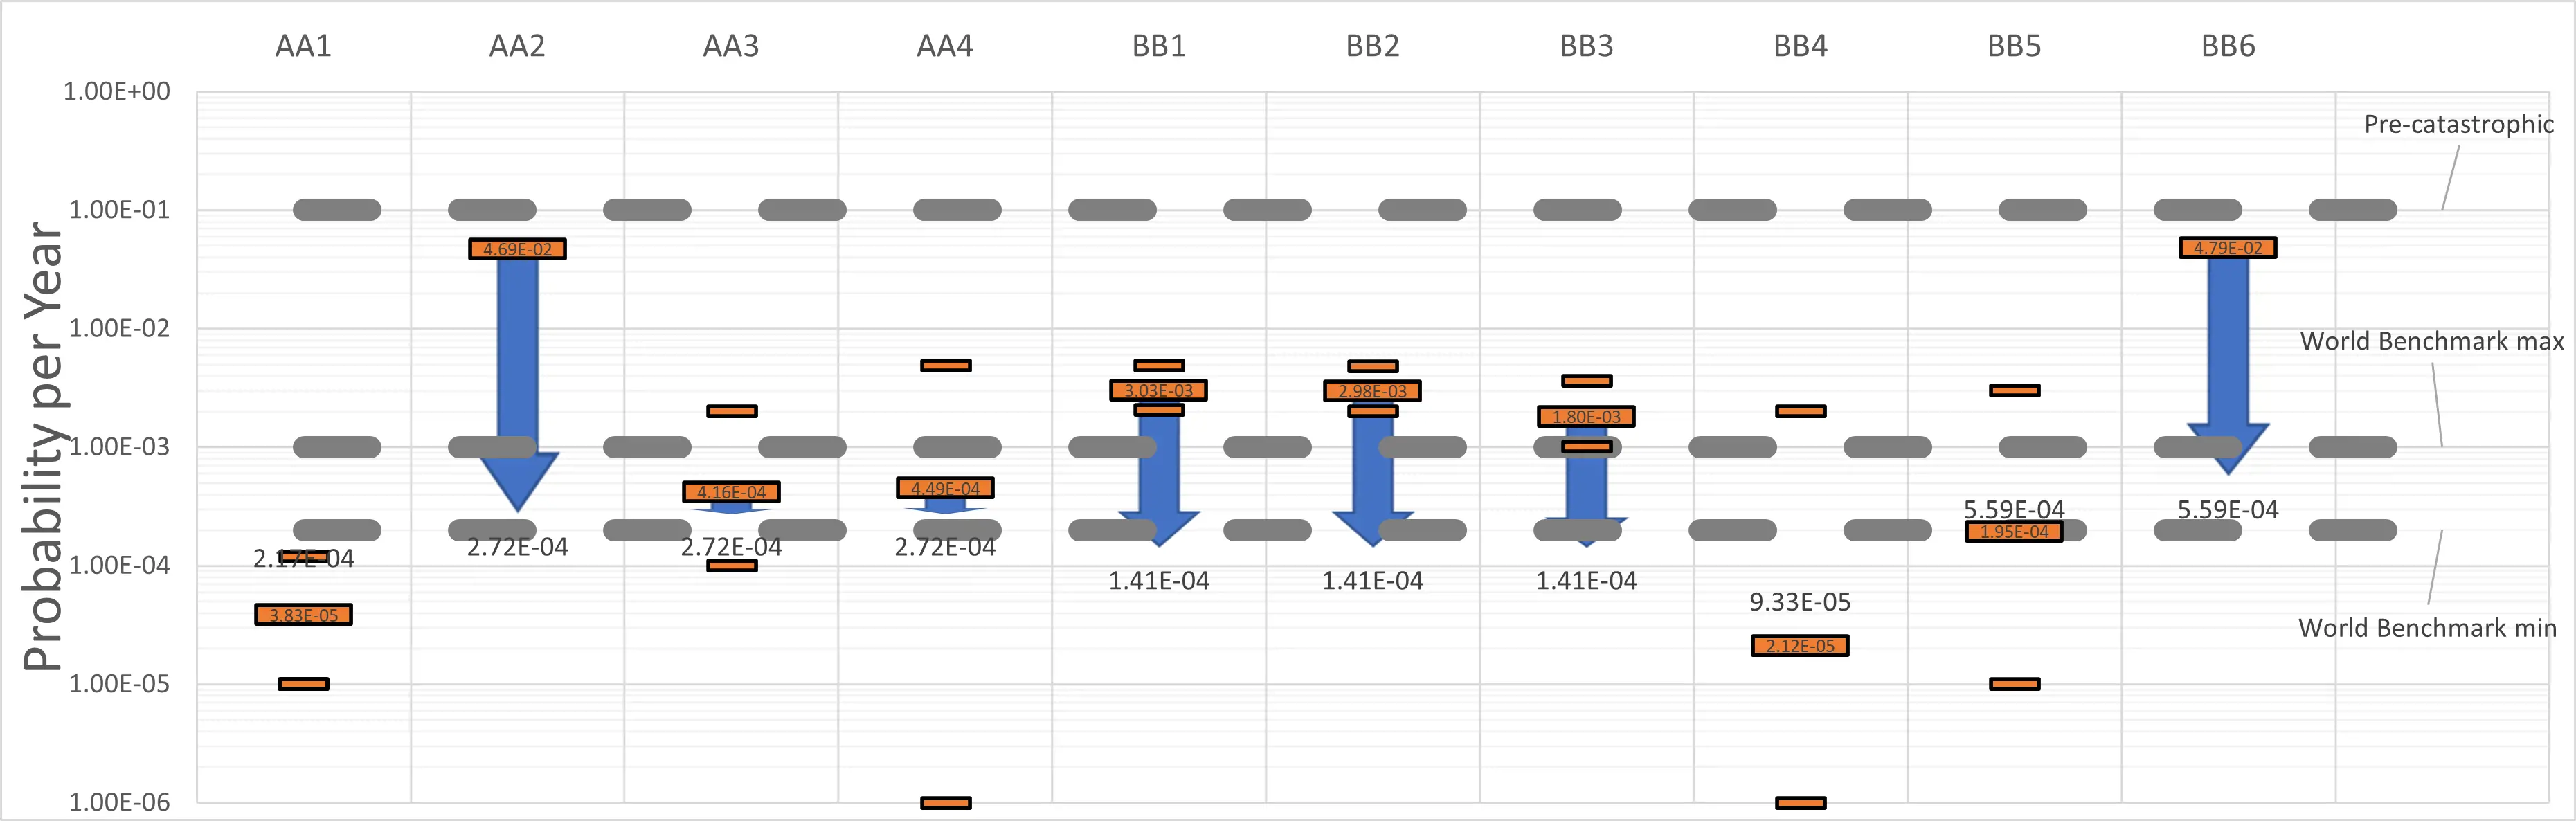
The portfolio of ten dams is displayed on the annualized probability of failure graph alongside worldwide benchmarks.
This graph shows dam AA1, which is entirely under the benchmark range, as well as AA3, which slightly straddles the benchmark range (uncertainty on the worse case pf estimate slightly above benchmark). AA4 is a little higher than AA3. BB4 and BB5 have average estimates below the benchmark range, but worse case slightly above.
The evaluation shows that dams BB1, BB2 and BB3 have an average annual probability and min-max estimates slightly above the highest benchmark. However, they display great potential for successful mitigation of ancillary water management issues. Lastly, AA2 and BB6 have high annual probabilities of failure, way above the global benchmark maximum. These dams also have great potential for mitigation, again, through ancillary water management enhancements.
Probability Ranking is not Sufficient to Allow Rational Planning
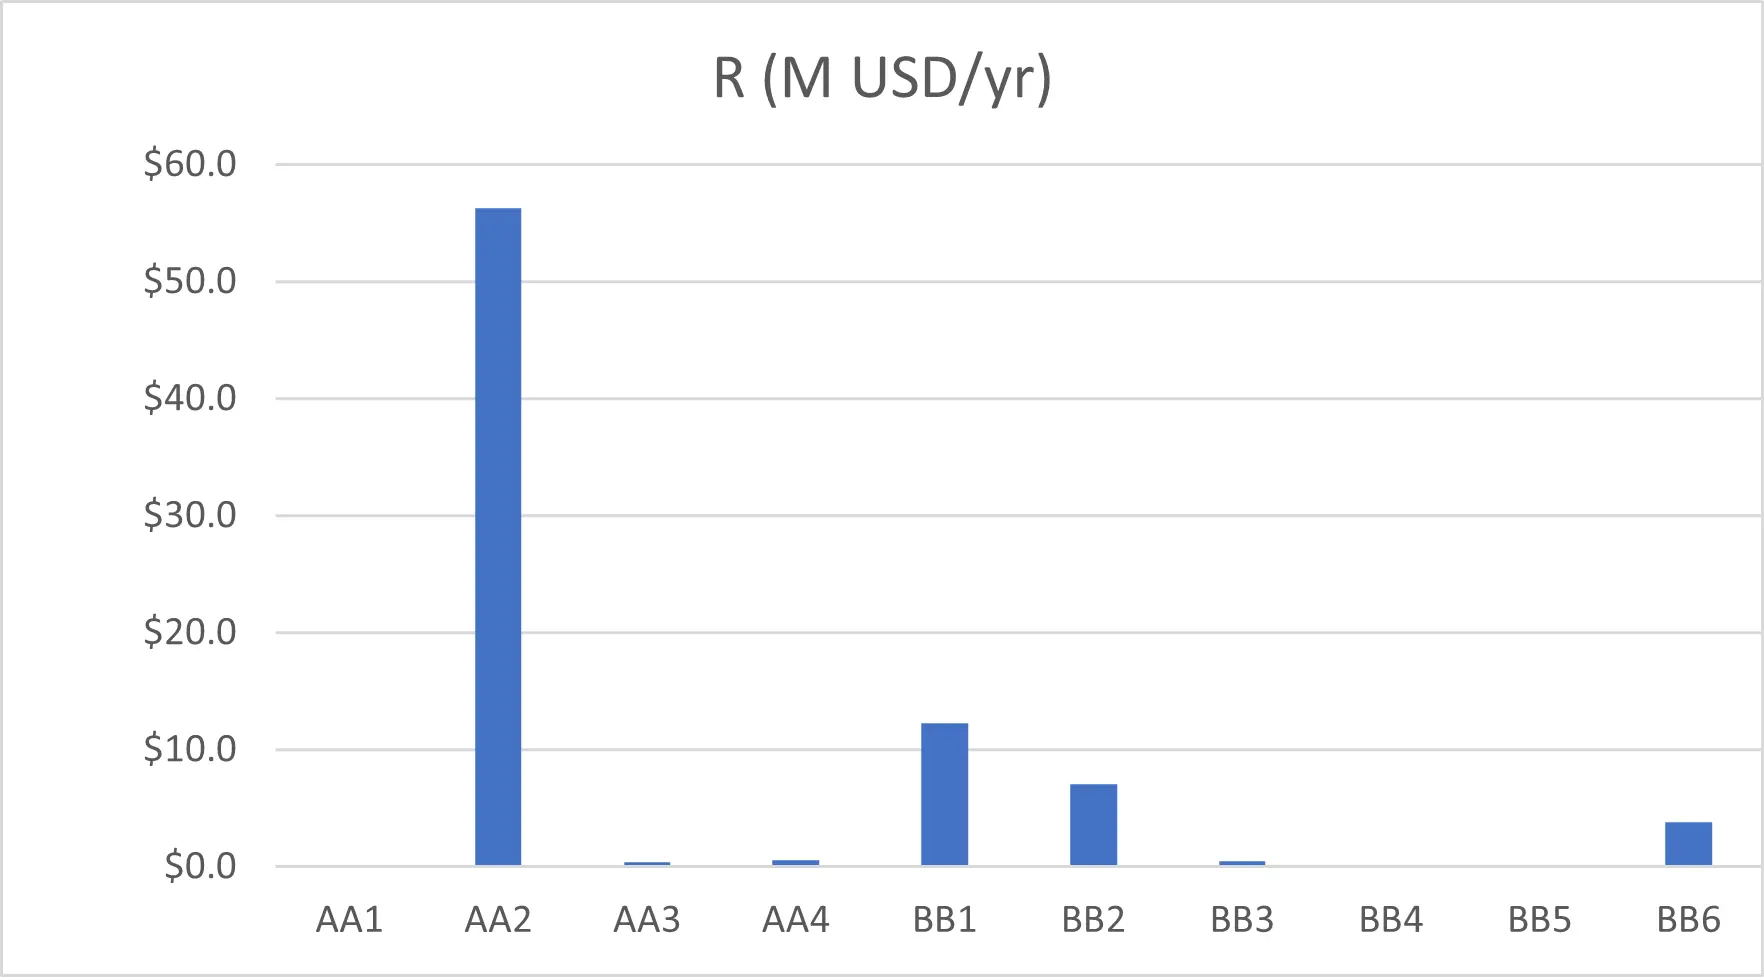
This graph is not sufficient for decision-making as it does not show the risks associated with the probabilities of failure. To evaluate the risks, we need to introduce the consequences of the failures of each dam. Thus, we get the following graph for the considered portfolio. The graph tells us that although they have similar probabilities of failure, dams AA2 and BB6 generate entirely different risks.
The graph tells us the highest risks are generated by dam AA2, then BB1, BB2, BB6. The rest generate “negligible” risk. Based on this, one would be tempted to split mitigative budget accordingly: 70%, 15%, 9%, 4% and the balance to the other dams. Is this true? Is this efficient?
The Right Way to Prioritize Risks
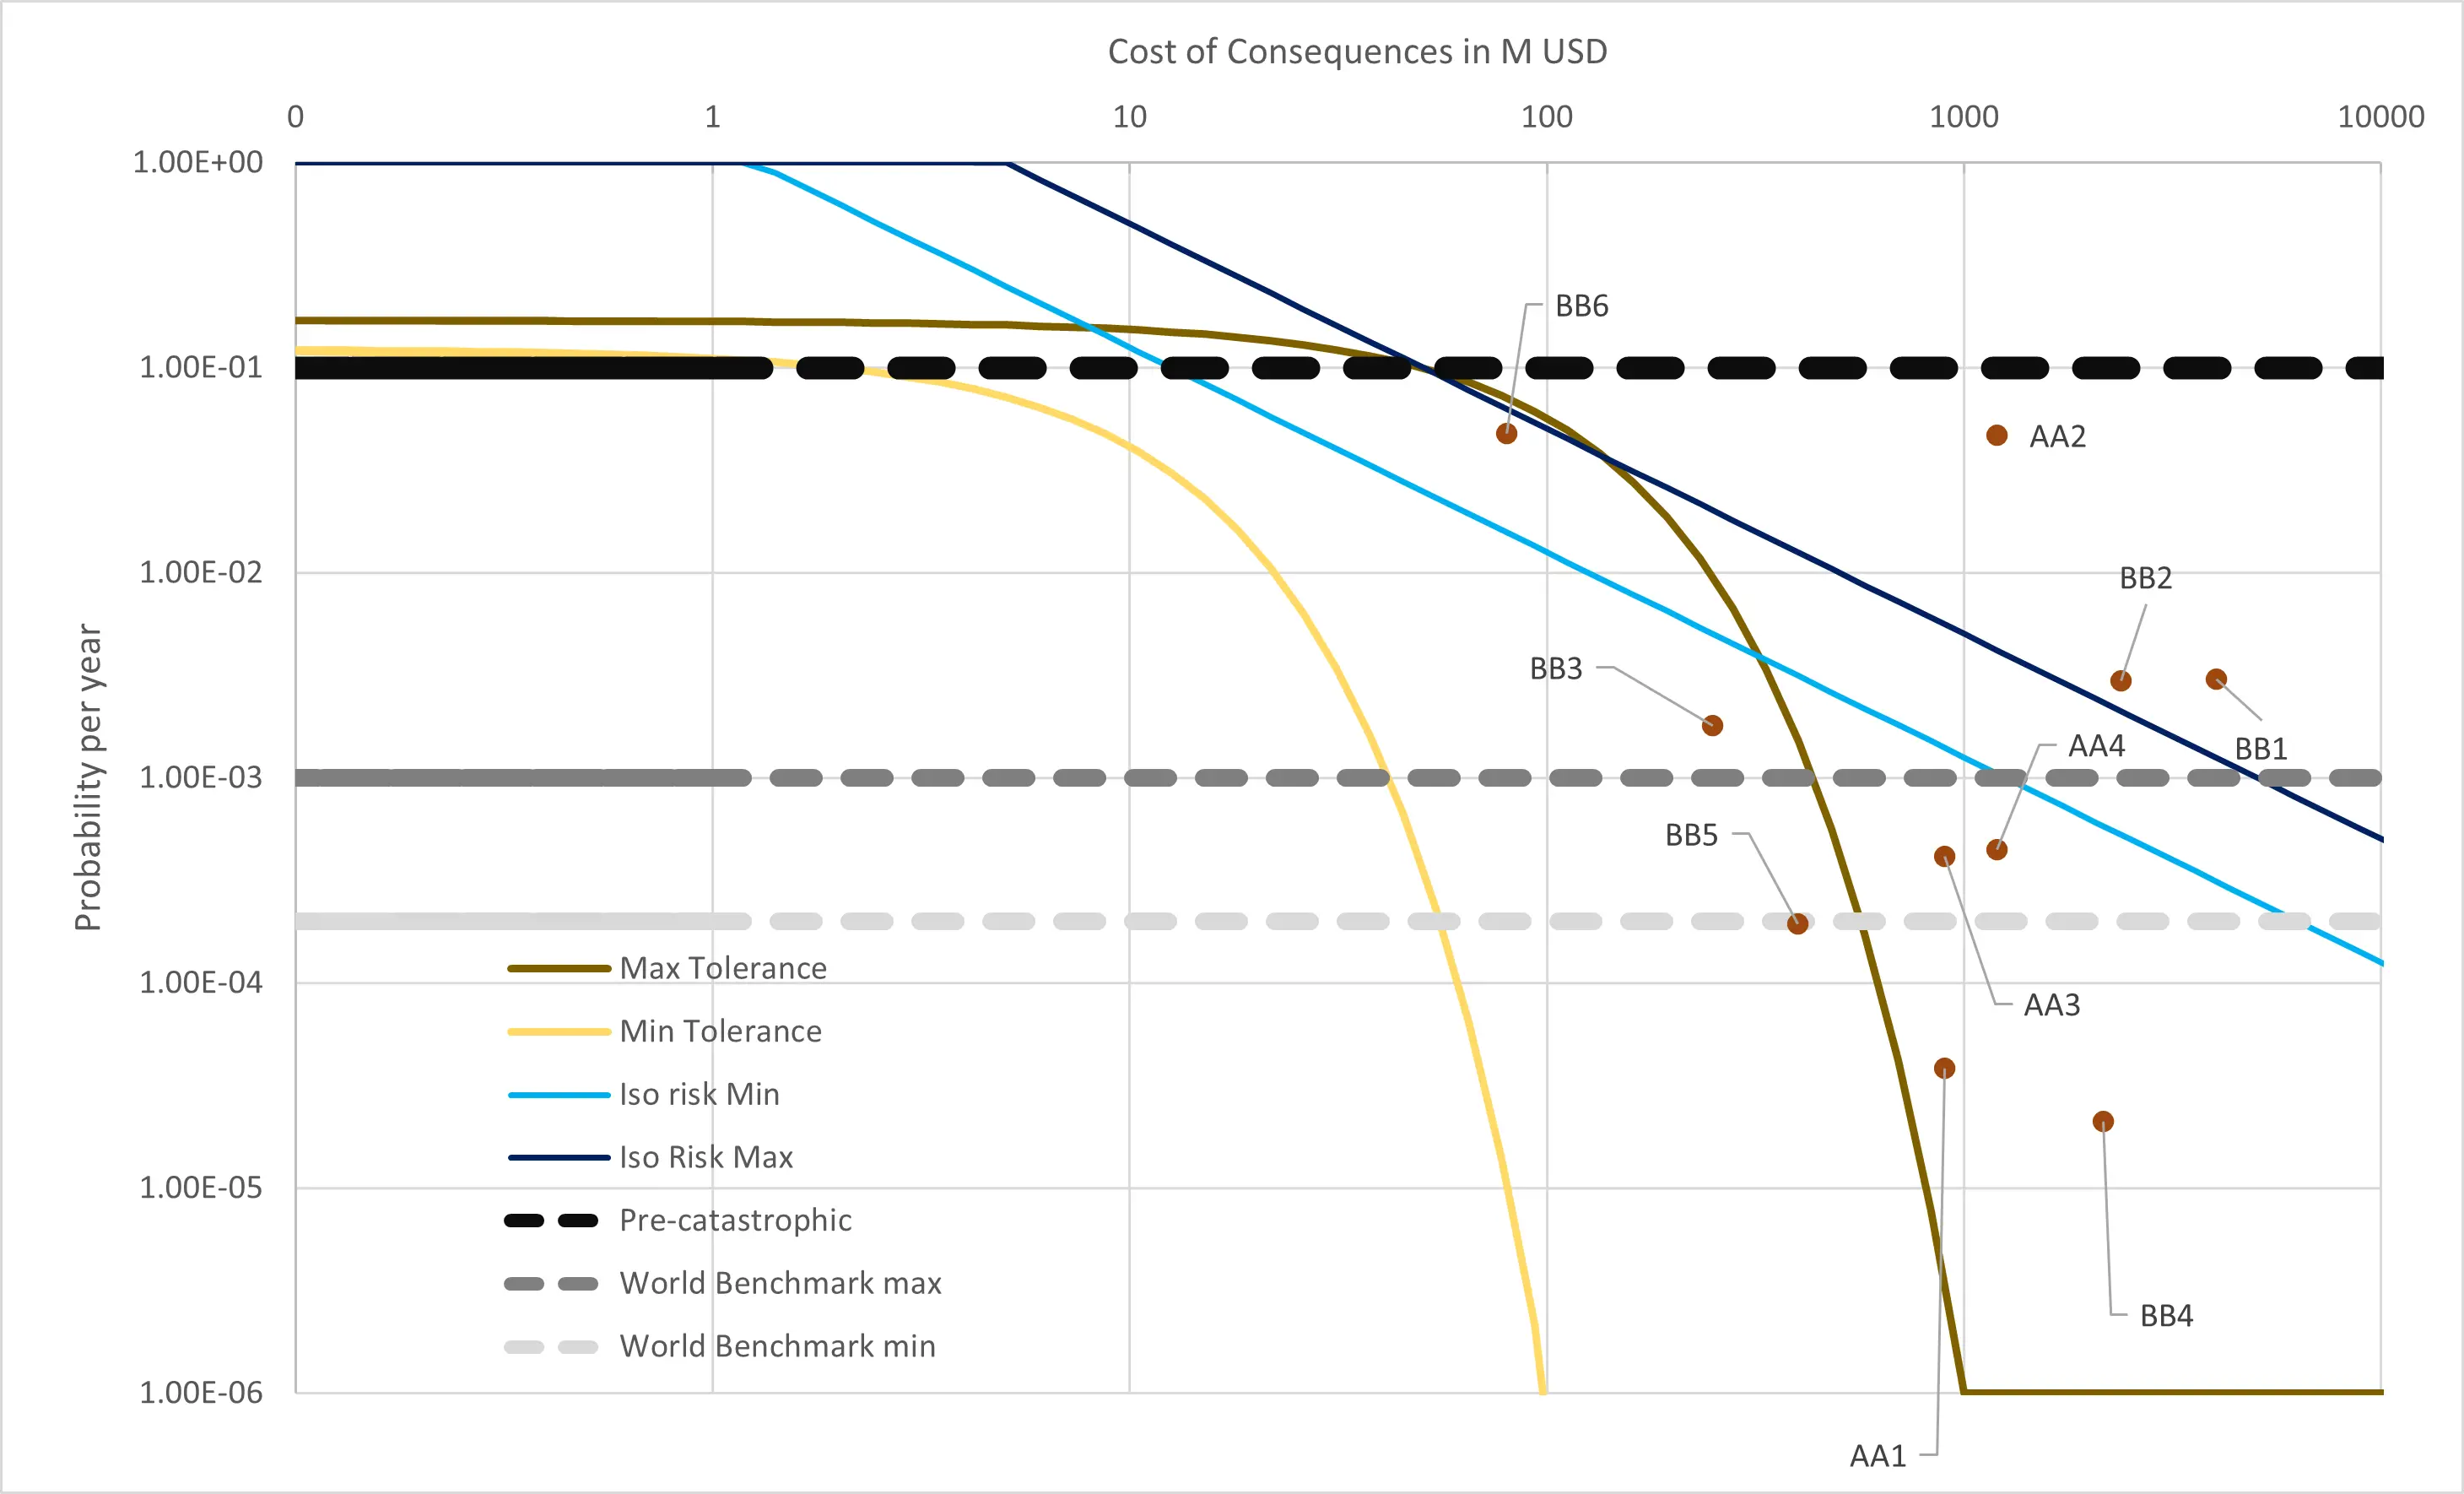
For a long time, we have stated that the right way to prioritize the risks is to use explicit risk tolerance. In the graph below, we report the same dams on an annualized probability of failure-consequence (pf-C) graph with two tolerances, operational and corporate, as well as the worldwide benchmarks.
For more information on tolerance thresholds, visit the risk tolerance threshold discussion.
We can see that in this portfolio, no dam is tolerable from an operational point of view. We also see that dams BB3, BB5 and BB6 (one of the highest probabilities of failure) are corporately tolerable. All the other dams are corporately intolerable. Thus, we can say that the prioritization of the risk from top to bottom is misleading. It is also evident that instinct and probability-only prioritizations lead to blunders.
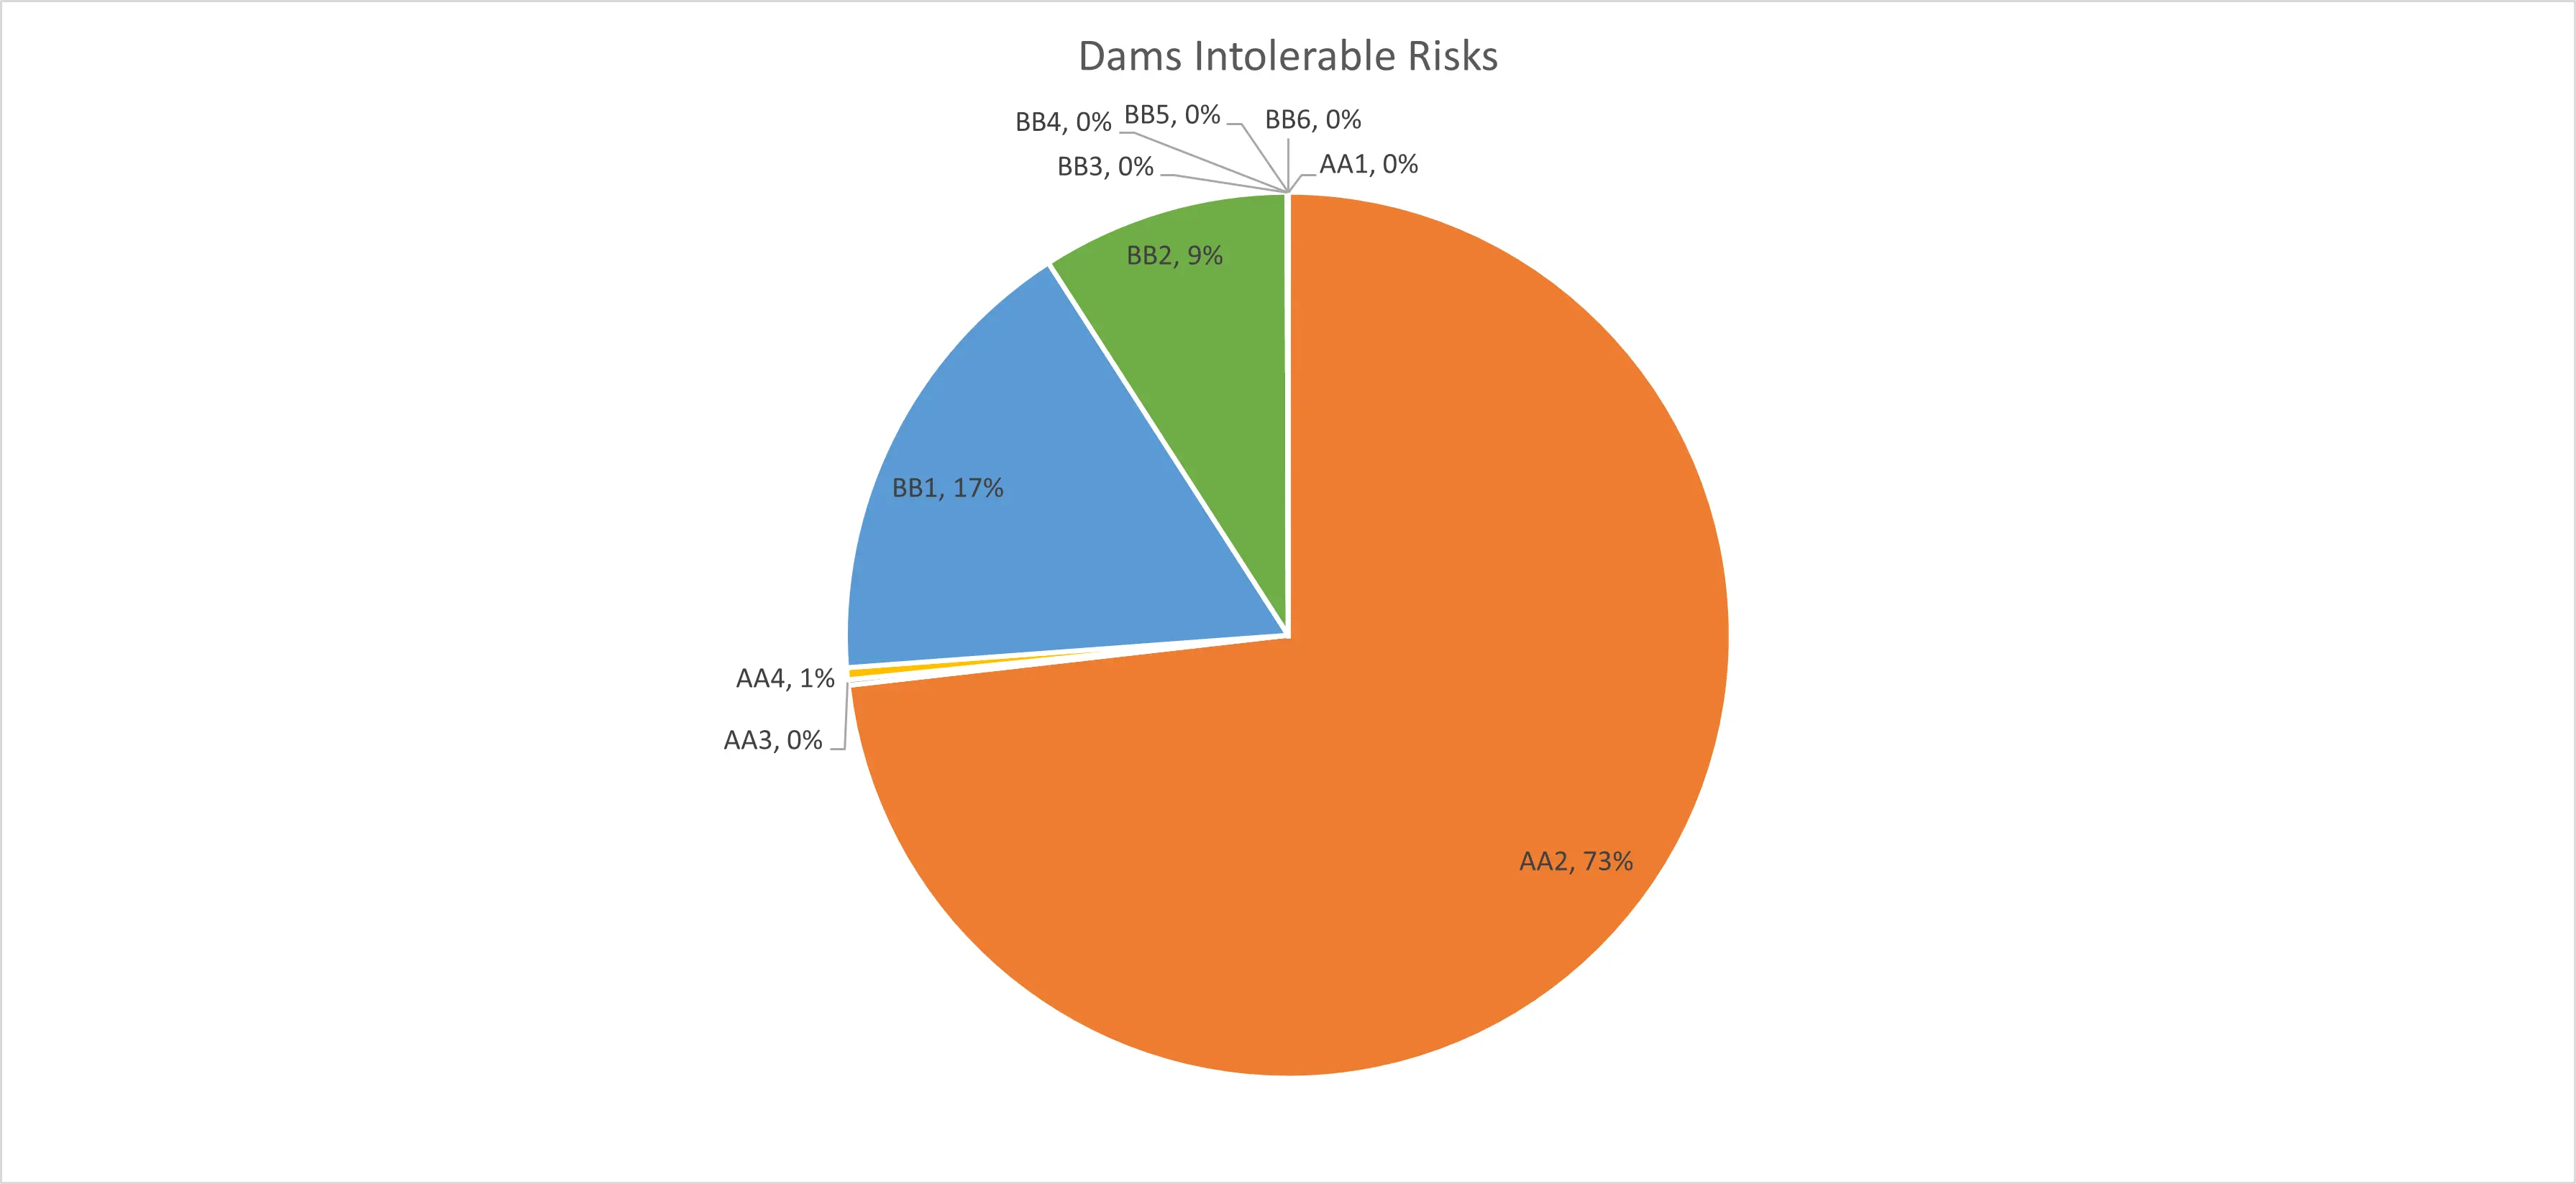
If we now look at the part of intolerable risk generated by the various intolerable dams, we get the figure below that shows that dams AA2, BB1, BB2 have the largest corporately intolerable risks. Thus, they should receive respectively 73%, 17% and 10% of the mitigative budget. Without taking into account the risk tolerance, the money allotted by the top-down approach to BB6 and the “minor risk dams” would be misallocated, which would leave AA2, BB1 and BB2 overexposed.
Closing Remarks
ORE2_Tailings can help support GISTM compliance and enhance rational and well-balanced mitigative planning.