The comparison of ORE2_Tailings™−estimated dam failure probabilities is an important element of our continued commitment to test the validity of our approach.
Quantitative Risk Assessment in Tailings
One can perform a Quantitative Risk Assessment (QRA) using various methods. For tailings dam risks, they consist of evaluating the probability of failure of the dam generated by various pertinent hazards, potential consequences of a dam system collapse (failure) and finally, the risk.
The technical and mathematical tools for performing QRAs are well known. Lack of specific instruction or experience in this field may result in oversimplification of the process. Analysts often use bits and pieces of various methods that do not adequately assess risk. Beyond the inevitable uncertainties, the analysis can become weak. Two analysts can complete QRAs with significantly different results.
The new Global Industry Standard for Tailings Management (GISTM) asks mining companies and operators to develop QRAs for their dams. Additionally, the standard requires that the QRAs be updated regularly—though “regularly” is not defined.
We created ORE2_Tailings anticipating the requirements of the standard. The methodology shines when tackling portfolios of dams. We decided to test the reproducibility of ORE2_Tailings results and a formal QRA approach performed by a reputable engineering company specializing in QRA.
About ORE2_Tailings
Riskope developed the ORE2_Tailings proprietary methodology to streamline and facilitate the risk assessment of portfolios of tailings dams. Indeed, ORE2_Tailings will allow compliance with the GISTM once the knowledge base of each dam is acquired. ORE2_Tailings allows for enhanced understanding of tactical, strategic and operational risks within a portfolio, sustainable mitigative roadmaps and better risk communication, social licence to operate and corporate social responsibility.
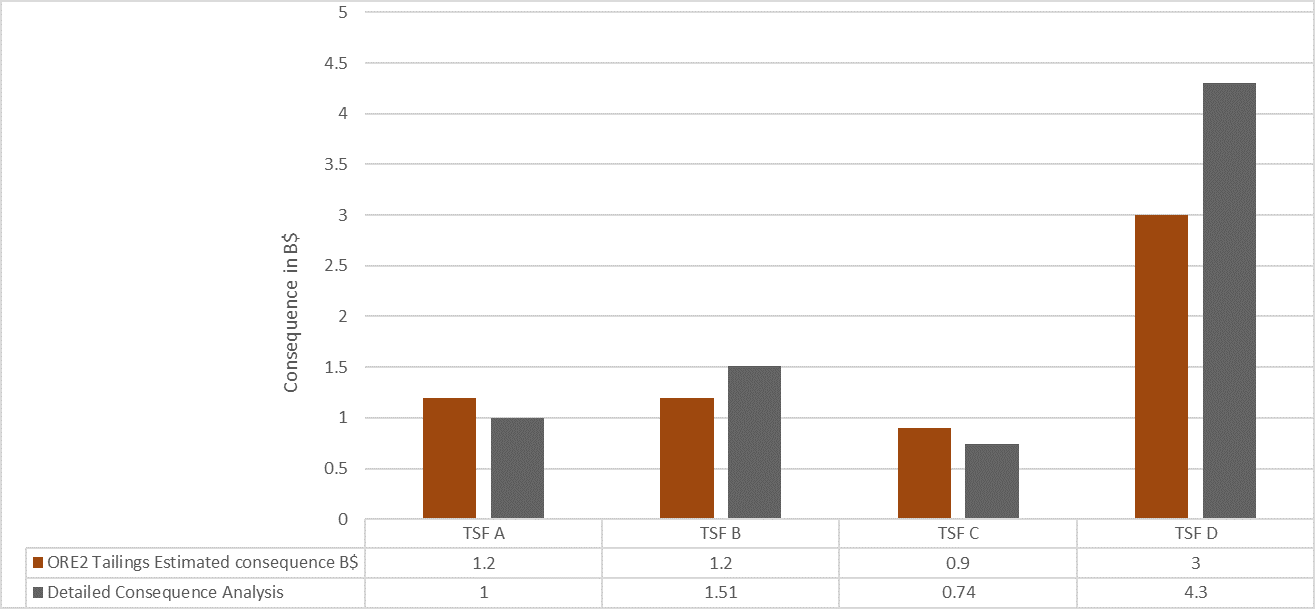
ORE2_Tailings also includes a simplified consequences analysis with a knowledge base evaluation/causality analysis.
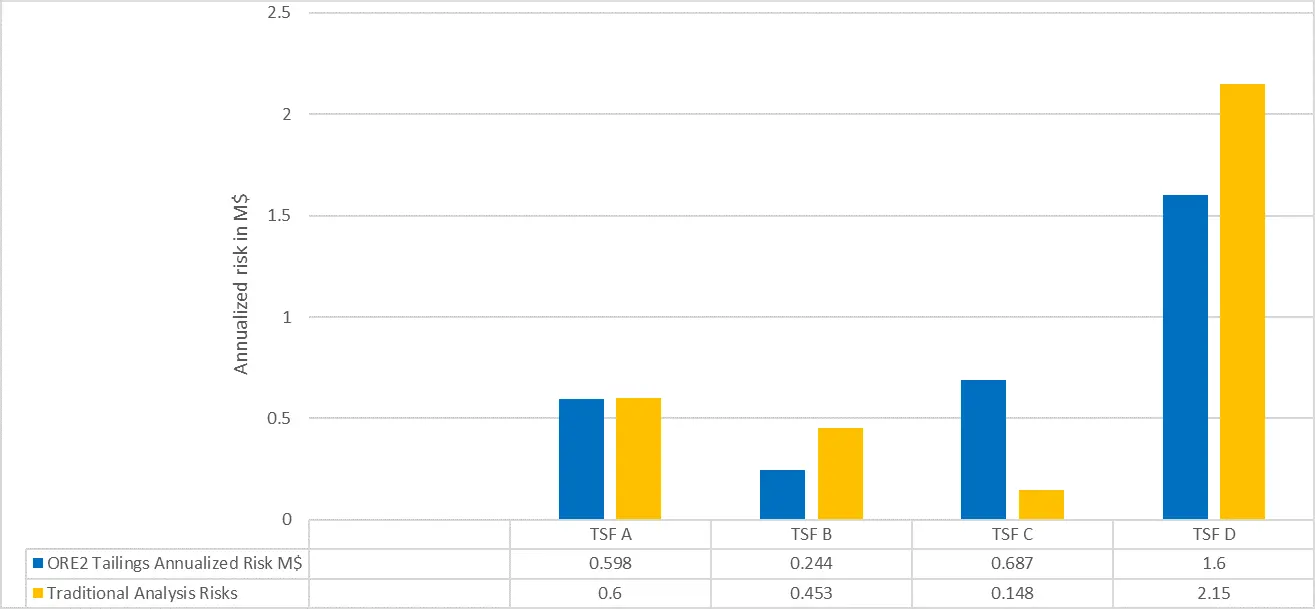
ORE2_Tailings benchmarks both the probability of failure and the consequences, i.e. multidimensional losses with respect to the worldwide portfolio.
Case History
In this case, we deployed ORE2_Tailings on a small portfolio of tailings storage facilities (TSFs). The portfolio includes four dams: TSF A, B, C and D. A reputable independent international engineering company then analyzed the same portfolio using formal quantitative approaches. Failure trees constituted the core of that formal approach.
Riskope used various engineering reports and other documentation available at the time of their deployment. These included engineering stability analyses developed for a series of conditions: Model Case I, J, K, L and M. The ORE2_Tailings deployment was completely remote, with no interaction with the owner or the engineers of record (EoR) of the tailings systems. However, the engineering company, during their own analysis, had the opportunity to speak to the owners and EoR and thus gained more knowledge on the systems.
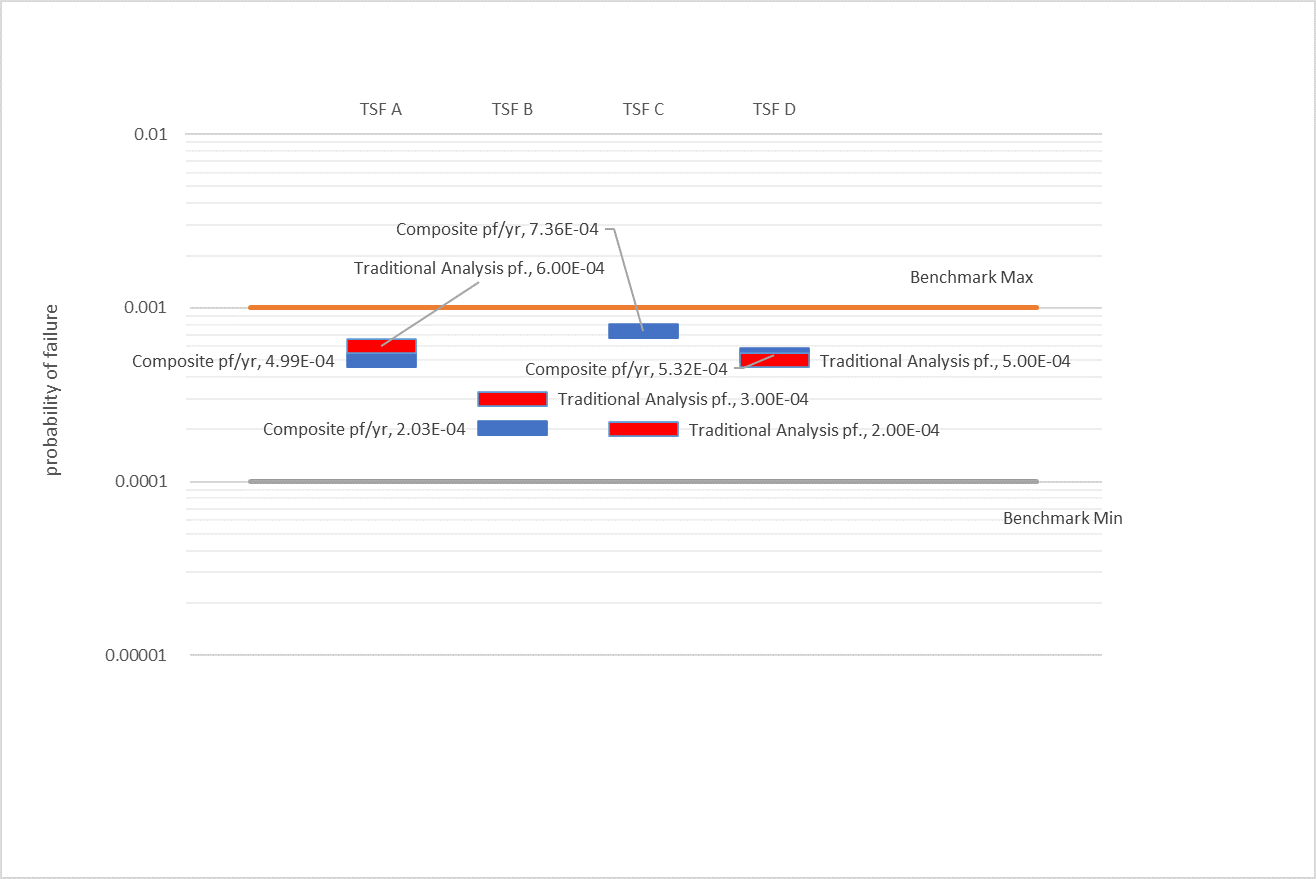
Comparison of ORE2_Tailings Estimated Dam Failure Probabilities
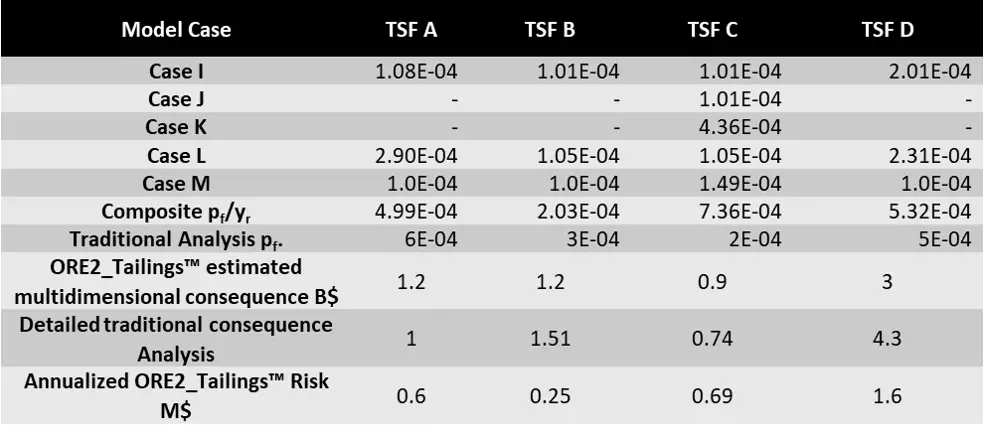
The table below displays ORE2_Tailings preliminary deployment results. These are probabilities of failure, consequences and risk yielded by the methodology before additional information was obtained through any workshop.
Table: ORE2_Tailings estimates of the annual probability of failure with PMF=1/10,000 and “as is” assumptions.